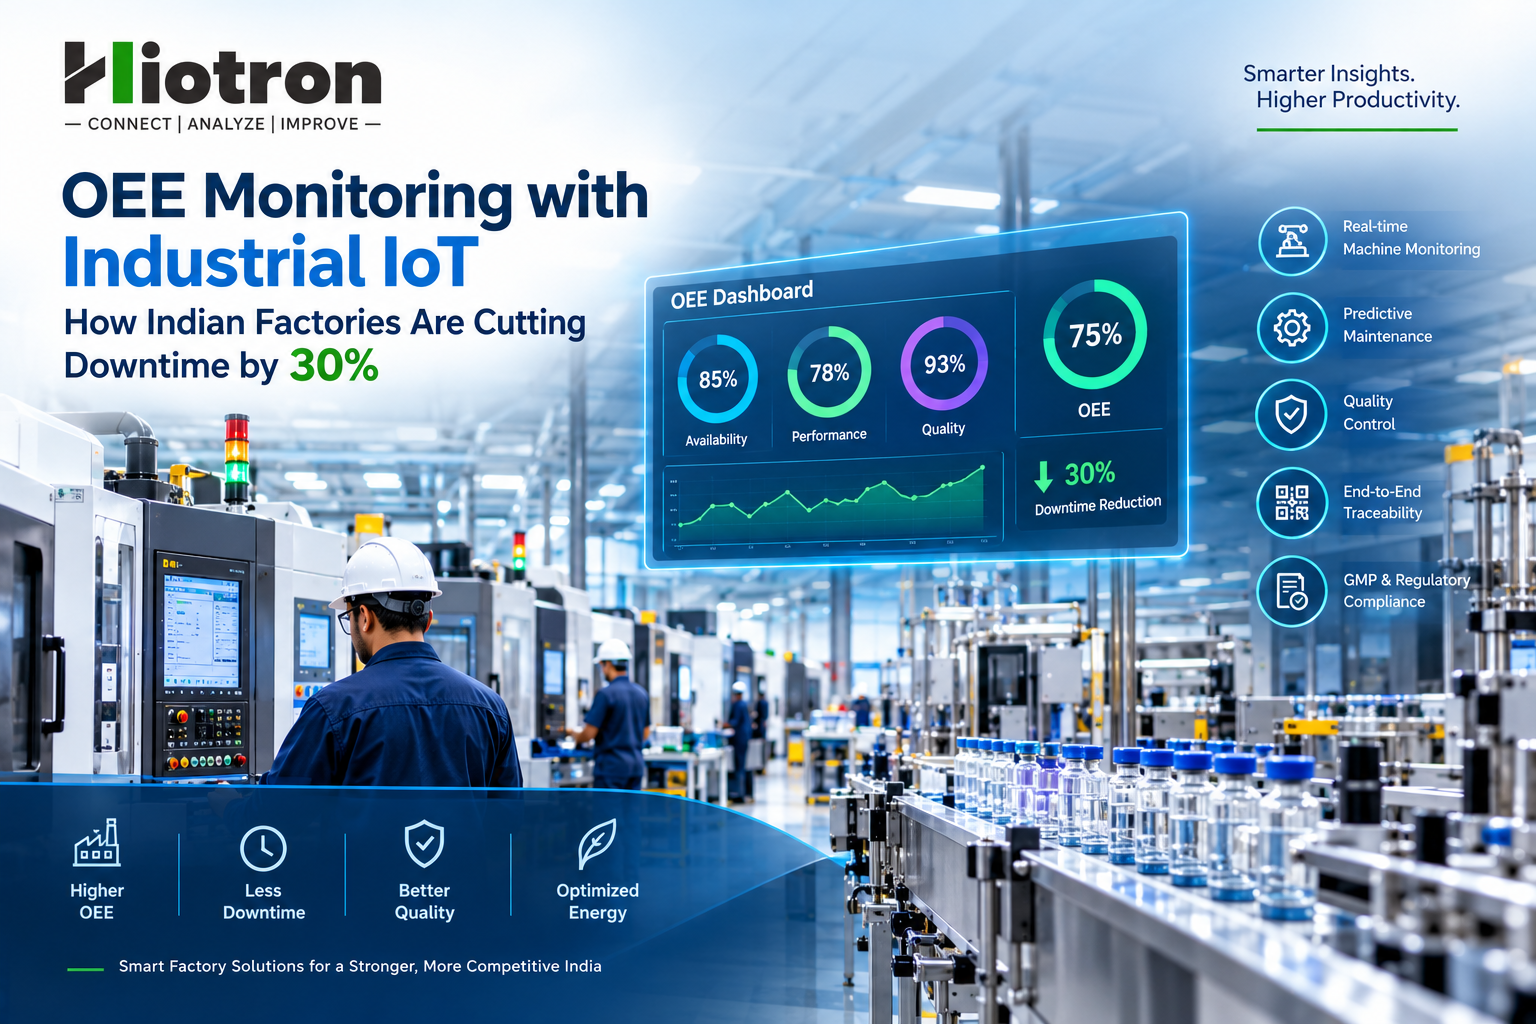
Most Indian factories run at 40–65% OEE, which means up to half of installed capacity quietly disappears into stoppages, slow cycles and scrap. If you are evaluating OEE monitoring software India plants can trust, the question is no longer whether to measure, but how fast you can see losses and act on them. This guide shows how industrial IoT turns Overall Equipment Effectiveness from a monthly spreadsheet into a live, shift-by-shift improvement engine, and how hIOTron customers are using it to cut downtime by up to 30%.
Why OEE Is the Metric That Decides Factory Profitability
OEE multiplies three factors: availability, performance and quality. A line with 90% availability, 80% performance and 95% quality delivers only 68% OEE. Every percentage point you recover is extra output from machines you already own.
According to TeepTrak’s State of OEE 2026 report, median manufacturing OEE sits near 60%, the top quartile near 75%, and world-class plants near 85% (ISO 22400-2). The same report estimates the “hidden factory” of lost capacity at 30 to 45 percent.
The Indian OEE Reality Check
TeepTrak’s 2026 India benchmark puts typical OEE at 60–75% for automotive Tier 1 suppliers, but only 40–58% for Tier 2–3 suppliers. Pharmaceuticals typically run at 55–72%, electronics assembly at 50–68%, and plastics and packaging at 50–65%.
That gap is the opportunity. The same source cites a supplier that moved from 47% to 72% OEE across 40 sites in 18 months using automated monitoring and data-driven discipline, without buying new machines or adding headcount.
The Real Cost of Downtime for Manufacturers
Downtime is the largest OEE loss in most plants, and it is expensive. Siemens’ True Cost of Downtime 2024 report estimates that Fortune Global 500 companies lose about $1.4 trillion a year to unplanned downtime, roughly 11% of their revenues. It puts automotive plants at around $2.3 million per hour of stoppage.
Indian plants operate at a smaller scale, but the logic is identical. A press line that stops for 45 minutes during a customer-critical shift costs you output, overtime, expediting charges and sometimes the customer’s trust.
Why Manual OEE Tracking Hides the Problem
Paper logs and Excel sheets flatter reality. TeepTrak reports that manual logs overstate true OEE by 8 to 15 points, because short stops and speed losses are invisible to hand-tracking.
- Micro-stops go unrecorded: 2-minute jams never reach the logbook, yet they add up to hours per week.
- Reason codes are guessed: operators fill them at shift end from memory.
- Data arrives late: by the time the weekly review happens, the cause is gone.
How Industrial IoT OEE Monitoring Works
Industrial IoT OEE monitoring removes human guesswork. Sensors and gateways read machine signals directly, software classifies every second of time, and dashboards show losses as they happen.
Step 1: Connect Every Machine, New or Legacy
Most Indian shop floors mix modern CNCs with 20-year-old presses. Plug-and-play IoT hardware reads PLC data on newer machines and uses current, vibration or cycle sensors on older ones. No machine needs replacing to join the network.
Step 2: Capture Availability, Performance and Quality Automatically
- Availability: run, idle and stop states are timestamped to the second.
- Performance: actual cycle time is compared with ideal cycle time to expose slow running.
- Quality: good and rejected counts link to each shift, part number and operator.
Step 3: Classify the Six Big Losses
Good factory downtime reduction India programmes start with a Pareto of losses: breakdowns, changeovers, minor stops, reduced speed, startup rejects and production rejects. Software prompts the operator for a reason code the moment a stop crosses a threshold, so the data is accurate and fresh.
Step 4: Alert, Act and Close the Loop
Live andon boards and mobile alerts tell supervisors and maintenance teams when a machine stops. No-code workflows can escalate a stop that lasts beyond 10 minutes, raise a maintenance ticket and log the response time automatically.
Where Overall Equipment Effectiveness IoT Pays Off by Industry
Different industries lose OEE in different places, so a good platform adapts to each.
- Automotive: changeover time and micro-stops on press, machining and assembly lines drive most losses. Tier 2–3 suppliers have the most room to grow.
- Aerospace and heavy engineering: long, expensive cycles make unplanned stops very costly; condition data on spindles and drives prevents surprises.
- Electronics: SMT line stoppages, feeder errors and rework dominate; real-time counts expose yield loss early.
- Plastics and packaging: mould changes, material starvation and speed loss are the usual culprits.
- Chemicals, pharma and process manufacturing: batch-time overruns and cleaning cycles matter more than piece counts, and audit-ready records are a bonus.
Realistic Results: What a 30% Downtime Reduction Looks Like
Plants that go live with automated monitoring usually see value in three phases. Visibility comes in the first weeks, when hidden stops finally show up. Focused fixes on the top three loss reasons follow over the next two to three months. Sustained gains appear as daily reviews become routine.
A 30% cut in downtime on a line at 60% OEE with 80% availability lifts availability to roughly 86%. At unchanged performance and quality, OEE rises by about 4 points, equal to roughly 7% more output from the same assets. On a line making 10,000 parts a day, that is around 700 extra good parts without new capital spend.
A Simple Roadmap for Your First 90 Days
- Days 1–15: pick a pilot line of 5–10 machines and agree ideal cycle times and reason codes.
- Days 16–45: install hardware, validate counts against manual records and train operators.
- Days 46–90: run daily 15-minute loss reviews, fix the top three losses and scale to the next line.
What to Look for in OEE Monitoring Software in India
- Works with legacy machines: retrofit sensors, not rip-and-replace.
- Automatic data capture: operators confirm reasons rather than type numbers.
- Edge buffering: data survives network or power interruptions common on Indian shop floors.
- Local deployment and support: on-site commissioning and Hindi, Marathi or English operator screens.
- Beyond OEE: predictive maintenance, quality and energy monitoring on one platform.
- No-code configuration: your engineers should adjust dashboards and alerts without developers.
This is exactly why FactoryMetrics, hIOTron’s Industry 4.0 platform from Pune, combines plug-and-play IoT hardware, AI-driven analytics and no-code workflow automation in one stack.
Common OEE Mistakes Indian Plants Should Avoid
Even with the right technology, programmes stall when basics are skipped. Watch for these traps before you scale.
- Using nameplate speed as the ideal cycle: if the target is unrealistic, performance data loses credibility with operators.
- Treating OEE as a scoreboard: the number matters less than the loss reasons behind it. Review causes, not just percentages.
- Comparing unlike machines: a changeover-heavy press and a continuous extruder need different targets.
- Skipping operator buy-in: involve shop-floor teams early. When operators see that data removes paperwork and helps them win arguments about root causes, adoption follows.
- Ignoring maintenance data: link OEE stops to maintenance records so repeat failures trigger preventive action.
Connecting OEE to Predictive Maintenance and Energy Monitoring
OEE tells you what you lost. Condition data tells you why it will happen again. When vibration, temperature and current readings feed the same platform, a rising bearing signature can trigger a maintenance order days before a breakdown, turning unplanned downtime into planned work. Energy data adds a third view: a machine idling for two hours per shift wastes power as well as capacity.
Frequently Asked Questions About OEE Monitoring
What is a good OEE score for an Indian factory?
World-class OEE is about 85%, but realistic targets depend on the sector. Automotive Tier 1 plants can aim for 80%, while Tier 2–3 suppliers often set 65% as a first milestone, according to TeepTrak’s 2026 India benchmark.
How does OEE monitoring software reduce factory downtime?
It records every stop automatically, ranks causes by lost minutes and alerts teams in real time. Teams then fix the biggest losses first instead of guessing.
Can OEE be tracked on older machines without PLCs?
Yes. Retrofit sensors for current, vibration, proximity or cycle counting can infer run and stop states on legacy equipment, so older machines join the same dashboard.
How long does it take to see results from industrial IoT OEE monitoring?
Visibility is immediate after installation. Most plants identify their top loss reasons within the first month and see measurable OEE gains within one to three months of focused action.
Is OEE monitoring only for large manufacturers?
No. Small and mid-size plants often gain the most because they start from lower OEE. A pilot on one line keeps the investment small and proves ROI quickly.
Start Measuring Your Real OEE with FactoryMetrics
You cannot recover capacity you cannot see. FactoryMetrics by hIOTron gives automotive, aerospace, electronics, chemicals and pharma, plastics and packaging, and heavy engineering manufacturers live OEE, downtime analysis, predictive maintenance and energy insights from one platform.
Ready to find your hidden factory? Explore FactoryMetrics and book a demo to see your first line’s OEE live within weeks.
Sources: TeepTrak, “The State of OEE 2026” (June 2026) and “OEE Benchmark India” (June 2026); Siemens, “The True Cost of Downtime 2024”.